






A single stimp reading is only valid inside a published tolerance. USGA’s booklet accepts readings within 8 inches of each other, and the survey literature treats a 2 to 3 times roll ratio as normal. Two greens measured the same afternoon can differ by more than the tolerance.
Specification comes before product here. On our line, each putting roll leaves inspection with pile height and density on its ticket. The 20 cm × 20 cm bench sample we post is cut from that same run. A putting green ball roll figure is worth nothing until its test is named.
How the Stimpmeter Protocol Actually Works
The instrument is deliberately dull. A Stimpmeter is an extruded aluminium bar 36 inches long, with a V-groove down each side. USGA’s stimpmeter instruction booklet fixes the rest: a 145-degree angle holding the ball at two points half an inch apart.
Two notches set the release. The 1X sits about 30 inches from the tapered end and is the full-length run whenever the surface allows. The 2X sits nearly 14 inches from the same end, a half-length substitute for tight spaces. Both notches release the ball at about the same angle. The 2X lip sits lower, so the ball leaves it at roughly half the velocity of a 1X run, which is why the 2X reading is doubled.
Every putting green ball roll figure begins with a level area 10 to 12 feet long. Release three balls, mark where each stops, then roll three the other way and average.
- Choose level ground: 10 to 12 feet of clear run, away from a seam.
- Release three balls from the 1X notch and mark each resting point.
- Repeat from the opposite direction on the same line, then average the two series.

Geometry explains the notch ratio. At 20 degrees the 1X release sits about 10.3 inches above the surface, the 2X about 4.8 inches, a ratio of 0.47. None of that survives a bad joint, which is why seaming a putting surface decides whether the ball crosses a ridge at all.
Measured this way a putting green ball roll is a distance, not a speed. It transfers only when the notch, the direction count and the surface state travel with it.
Never average the two directions before checking them. If the series differ by more than 18 inches, the booklet calls the average questionable, and averaging hides exactly that fault.
Reading the Error Bars on One Number
Three balls must stop within 8 inches of each other, and a wider pattern is dubious, so the series is repeated. On a 10-foot reading that window is 6.7% of the number; it is 8.3% at 8 feet and 5.6% at 12 feet. One tolerance means three different things at three speeds.
The second limit runs between directions. If the first and second series differ by more than 18 inches, the average is questionable and another area should be chosen. Eighteen inches is 15% of a 10-foot reading and 12.5% of a 12-foot reading.
A putting green ball roll quoted to a decimal place claims precision the protocol does not offer. The 2X run tightens every limit: areas as short as 6 feet, dispersion of 4 inches, a 9-inch between-series limit, and the distance doubled. On a 10-foot equivalent those limits are 3.3% and 7.5%.
- Within a series on the 1X notch: 8 inches, or 6.7% of a 10-foot reading.
- Between series on the 1X notch: 18 inches, or 15% of a 10-foot reading.
- On the 2X notch: 4 inches within a series, 9 inches between, or 3.3% and 7.5%.
The ball is the one input the tester does not improvise. A conforming ball weighs no more than 45.93 g and measures at least 42.67 mm across, per the published limits on ball weight and size. Anything outside that envelope moves the roll for reasons unrelated to grass.
The figure is also local by design, because the Stimpmeter is not intended for course comparisons. Compare one green against itself across seasons instead. Use picking the right putting turf when the question is which surface to buy.
Report the notch, the series count and the spread beside every figure. Ten feet with an 18-inch spread and ten feet with a 4-inch spread are two different claims about one green.
Why Slope and Base Move the Reading
A green that reads 10 feet downhill and 5 feet uphill is not a 10-foot green. The USGA Course Rating System Guide calls a green moderately sloped when the downhill roll runs 2 times the uphill roll, and steeply sloped at 3 times.
Percent grade puts the same idea into building terms. One degree of slope is about 1.75% grade, which is why the 3% limit is quoted as 1.7 degrees. The major portion of a putting green should usually not exceed 3%, and 3% at a 10-foot reading is too steep for hole use.

Friction is the other half of the same story. a peer-reviewed study on maintenance and sand-filled surfaces ties deceleration to surface condition rather than to slope alone.
What Base Condition Means Here
Base condition is the state of the surface on the day it is tested. The booklet asks for a cleanly mowed, dry, smooth surface on a calm day before any other reading is documented. Wind, a wet surface, unmown grass, recent rolling, topdressing, time of day and fertiliser history belong in a second column.
Pile Height and Density: What They Change
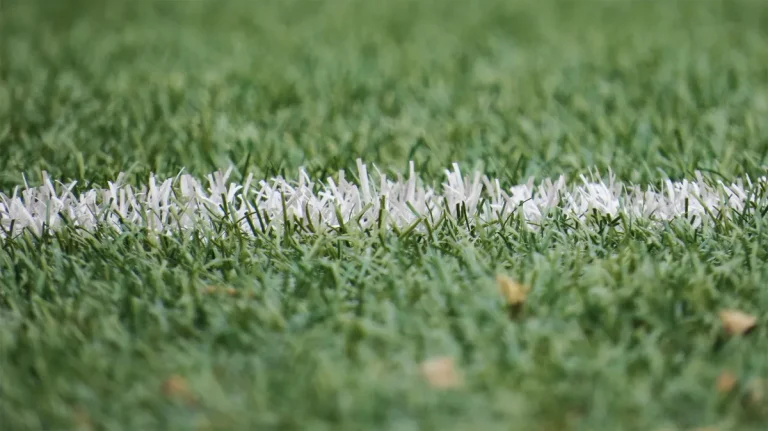
Pile height is the fibre standing above the backing; density is how many tufts stand per unit area. Neither is a speed setting on its own. Together they decide how far the ball deflects into the pile and how much tip it touches, and that pair is what a buyer really chooses.
Read them together or not at all. A short pile at high density is not the same surface as a short pile at low density, and raising pile height without touching density moves the ball again.
So the pair travels with the order. golf turf built for green work is quoted in pile and density together, because fixing pile height alone specifies half a surface.
- Pile height: fibre length above the backing, before any infill goes in.
- Density: tufts per unit area, which sets how firmly the pile resists deflection.
- Fibre above infill: the exposed tip the ball actually touches.
- Both together: the pair that decides how much the surface can slow a ball.

Why Tip Contact Beats Carpet Feel
A putting surface has to hold a line at low speed, and low speed is where tip contact dominates. Two surfaces can share a pile height and still send the same ball different distances, purely on tufts per square metre.
Infill: Two Regimes Behind One Contradiction
One camp says more infill makes a green faster, another says it makes the green slower, and both reports are honest. A laboratory study on sand-filled surfaces shows why neither side is wrong: the response is not a straight line.
Ball deceleration rose as infill increased to 10 kg/m² and showed no further significant increase across the range tested. That is the first regime, and inside it more sand means a slower ball. The study placed the optimum at 25–30 kg/m², roughly 5.1 to 6.1 lb/sq ft, judged on performance and the fibre left above the infill.
The second regime explains the opposite report. Past that plateau, adding infill still raised surface hardness, reduced ball rebound and reduced rotational resistance, all linearly. Those are the properties a player reads as fast, even though deceleration has stopped climbing.
- 0 to 10 kg/m², to about 2.0 lb/sq ft: deceleration climbs, so the ball slows.
- 10 to 25 kg/m²: deceleration flat while hardness keeps rising.
- 25 to 30 kg/m², or 5.1 to 6.1 lb/sq ft: the study’s optimum band.
- Above 35 kg/m²: low rebound, low rotational resistance, buried fibre.
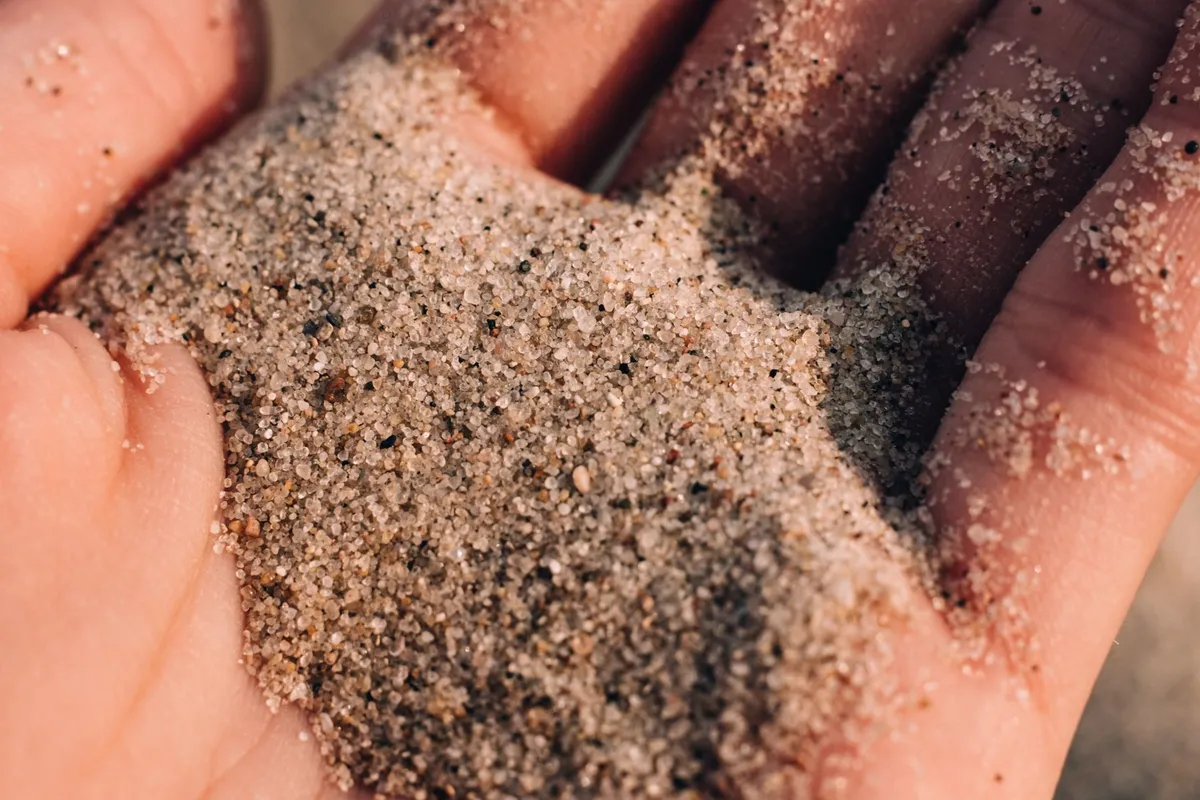
Contamination pushes one way only. Dirty infill increased ball deceleration, cut the infiltration rate and kept the surface wetter for longer while drying. sand-filled and non-infill green systems carry that load differently, so the system choice belongs before the infill figure is fixed.
Target Speeds That Fit the Facility
A target speed is a band with a date attached. What counts as normal has moved since the instrument entered use, and every published band carries the year it was written.
| Period | Documented band | What it describes | Source |
|---|---|---|---|
| 1976–77 | 6 ft 6 in national average; 7 ft 6 in called excitingly fast | First survey years of the instrument | USGA Green Section Record 46(4), 2008 |
| 1983 | 9.5 to 10.5 ft for most championships; above 11.5 ft too fast | Championship preparation | USGA Green Section Record 46(4), 2008 |
| 1983 | 7 ft 6 in to 8 ft 6 in | Daily-play preference | USGA Green Section Record 46(4), 2008 |
| 2006 | 9 ft 6 in to 10 ft 6 in | Advised range, where possible | USGA Green Section Record 46(4), 2008 |
| 2007 | 8 ft 1 in to 9 ft 4 in public; 9 ft 5 in to 10 ft 4 in private | Rated courses on the day | USGA Green Section Record 46(4), 2008 |
| 2008 | 7 to 12 ft documented; above 10 ft not recommended consistently | Working range for American courses | USGA Stimpmeter Instruction Booklet, range restated in that survey |
Read the column, not the newest row. The 1976–77 average of 6 ft 6 in against 10 ft is a 54% increase in measured roll. Faster is not automatically better either. Greens that are too fast slow play, cost more to hold and are harder on turf health. Championship preparation should be faster than daily play, without chasing a maximum.
the 2008 USGA green speed survey carries the whole sequence in one document, from the 1976 trials to the rated-course figures. It records what was measured, not what to build.
For a synthetic surface the logic survives with one change. A putting green ball roll target has to be fixed before installation, because pile, density and infill set it and no mowing height will move it afterwards.
Ask for a band, not a peak. A green specified at 9 ft 6 in to 10 ft 6 in is maintainable; one specified as fast as possible is a maintenance bill with no acceptance test.
Writing Ball Roll Into a Supply Spec
A speed target becomes buyable when four things sit in the same clause: the test method, the tolerance, the surface state at test and the acceptance point. Leave one out and two suppliers will quote two different greens.
- Test method: Stimpmeter, 1X notch, three balls each way, two series averaged.
- Tolerance: 8 inches within a series, 18 inches between series, repeat if either fails.
- Surface state: cleanly mowed, dry and calm at the acceptance date.
- Acceptance point: which green, which line, how many spots are averaged.
Put the state in the clause rather than a footnote. A damp morning after rain and a dry midday green are two different measurements, and the booklet’s baseline order exists so the comparison repeats. Record the notch and the direction count, or the figure cannot be audited.
Then tie the number to the product. the putting green turf range is specified in pile, density and backing, and those three set what the surface can be brought to. A clause naming a speed without them cannot be checked on delivery.
A putting green ball roll clause is a short document, not a slogan. It names the test, the pass mark and the date.
Need a Green That Holds Its Speed?
We supply putting turf in the pile and density your speed target needs, and we send a bench sample so you can roll a ball before the full order.
Dew, Rain and the Reading You Get
Moist turf is slower than dry turf at any mowing height. The booklet lists a wet surface among the conditions that must be documented separately, which puts dew in the same bracket as wind and unmown grass.
Synthetic surfaces can run the other way. On a synthetic soccer surface, wet conditions produced a 4.8% longer ball roll than dry, 6.2 m against 6.5 m. The same trial recorded 5.7% on Kentucky bluegrass and 8.9% on perennial ryegrass, summarised as roughly 5 to 10% depending on the surface.
- Dew or irrigation before the test: drift in either direction, depending on surface type.
- Wind: a documented condition, not a correction factor.
- Brushing: reduces ball speed, most of all at low speed.
- Grain: a known deterrent to uniform speed.
The mechanism is a water film, not a moisture reading. That trial used a 2.5-inch pile synthetic turf with 43 mm of infill, tested to the FIFA Quality Concept handbook. The result belongs to that construction rather than to a putting green. Lifting it onto a putting surface is an assumption, not a finding.
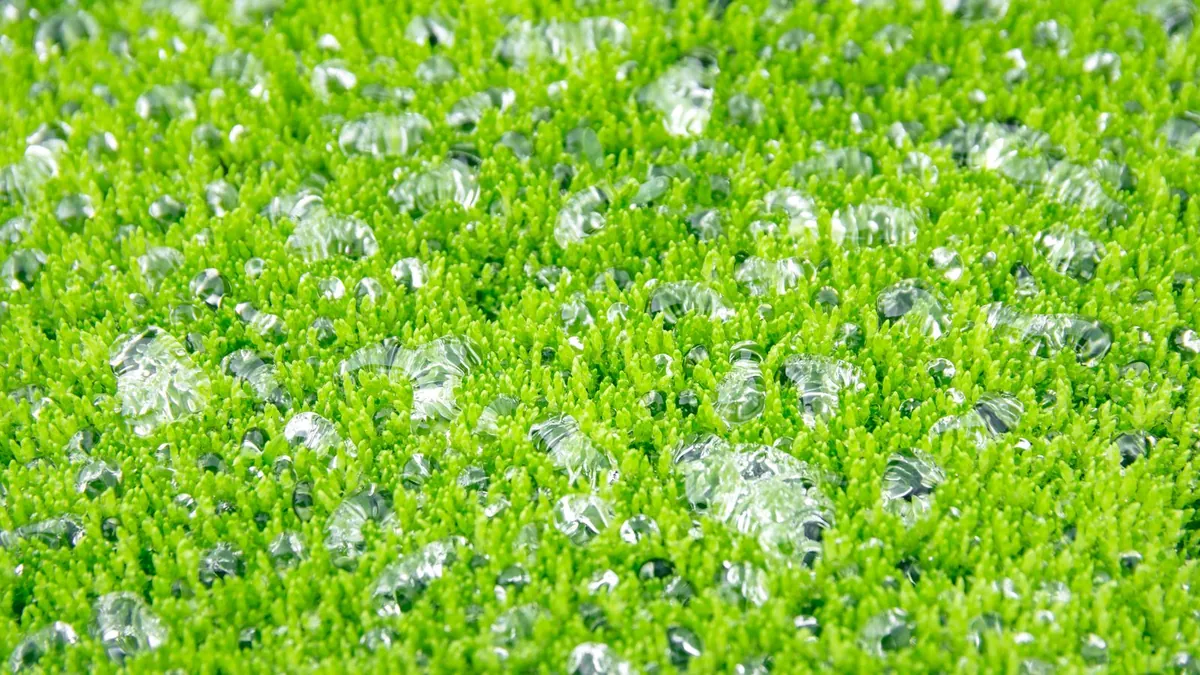
The wet-versus-dry figures above come from Penn State’s 2015 irrigation trial, whose ball-roll comparison was run on soccer turf.
Before the First Ball Rolls
Nothing here needs a laboratory, but the order of work decides whether the number means anything.
- Choose the line: level, 10 to 12 feet of clear run, clear of a seam and the edge.
- Sweep loose infill and debris off the line before the first release.
- Write the notch, direction, time and surface state on the result sheet.
- Run the whole set on a second spot before quoting a speed.
- Keep the sheet, because the next measurement is only useful against this one.
A green that fails the spread twice on the same line is reporting a seam or a base problem rather than a grass problem. Move the line before you change the specification.
Frequently Asked Questions
What stimp value should a practice putting green have?
A practice green usually sits in the daily-play band of 7 ft 6 in to 8 ft 6 in. The 2006 guidance of 9 ft 6 in to 10 ft 6 in suits a green built for tournament preparation.
How accurate is a single stimp reading?
Not very. Three balls must finish within 8 inches of each other, and two series more than 18 inches apart make the average questionable. At 10 feet those spreads are 6.7% and 15%.
Does sand infill make a putting green slower?
Up to about 2.0 lb/sq ft, yes: ball deceleration rises as infill increases. Past that plateau the surface keeps getting harder instead, which players read as faster.
How much does slope change the reading?
A great deal. A moderately sloped green rolls 2 times further downhill than uphill, and a steep one 3 times. A 3% grade is 1.7 degrees.
Does dew or rain change green speed?
Yes, and in opposite directions by surface. Natural turf rolls slower when wet, while a synthetic soccer surface in one trial rolled 4.8% further when wet.
Can green speed be changed after installation?
Only within limits. Pile, density and infill are fixed at manufacture, so a putting green ball roll target belongs in the specification rather than in a correction afterwards.