
A headteacher stares at the boot prints on the corridor floor after a rainy lunchtime. The marks trace back to the playground edge, then up the stair, and across every pair of shoes that walked back into the school. A decision about grass was never only a decision about grass, because the question a school or a childcare centre faces lands as two questions in one.
Fall impact and surface temperature have no single number to quote, so this comparison reads them as feeling rather than figures, and daily inspection hours decide the lifetime budget. This comparison treats it as one decision with two audiences, walking through use intensities, hygiene, inspection, availability, budget, the natural-grass boundary, and the parent conversation. Specific shockpad and named test methods sit in playground safety guidance, and the routes families walk in winter matter as much as the spec on any supplier order form.

What Schools and Childcare Actually Compare
Schools and childcare centres look similar from the outside. Both spend money on outdoor surfaces. The comparison they run, however, is not the same comparison. A primary school weighs a big playground with mixed use: break time, PE lessons, events, and wet boots on the corridor. A childcare centre weighs smaller outdoor areas, much younger children, diaper zones, and a daily cleaning clock that runs tighter than any academic timetable.
The first comparison point sits inside the daily routine, not on the spec sheet. The pattern of use decides which surface pays back. Playgrounds wear in circles around swings and slides, sports pitches wear along running lines and goal mouths, and outdoor learning corners wear under tables and benches. Natural grass struggles with circles, holds up better on full-field rotations, and falls apart fastest where the footfall never stops.
Playground Surfaces vs Sports Pitches: Two Use Intensities
A primary school usually runs two different surfaces side by side, and the comparison breaks if both are read as one. The playground takes scattered footfall all day, with hot zones under the play equipment. The sports pitch takes concentrated footfall along lines and circles for short bursts. The lawn around the school building takes almost no footfall at all.
Synthetic surfaces handle circles well. Natural grass handles open fields well. The wrong pick in either spot shows up within a school year. Playground failure on natural grass looks like bare soil rings under the swing set, muddy strips along the fence line, and dead patches where children line up. The same playground on synthetic stays green through the wet season, drains after rain, and returns the same surface every morning.
Sports pitch failure on natural grass looks like worn goal mouths, compacted soil along touchlines, and slow recovery between matches. On artificial turf installations built for school football, the lines stay crisp and the surface stays even across seasons, which simplifies booking and reduces disputes.
Childcare sits between the two. Use intensity is lower than a primary playground, but the children are younger, hygiene rules are stricter, and cleaning happens several times a day. The decision is usually not either-or. It is which area gets which surface.
Falls and Surface Temperature: What Families and Staff Feel
Two questions come up in every parent meeting and in every staff briefing. How hard is the surface when a child falls, and how hot does it get on a sunny afternoon? Honest answers do not start with numbers, because neither question has a single number a parent can take home. Honest answers start with what families and staff actually feel, then narrow to what a school can do about each feeling.
On fall impact, both natural and synthetic surfaces perform well when specified and installed for the use. Shockpad and base design do most of the work. The measurable comparison, with test methods and named standards, belongs to playground artificial grass safety guidance. This comparison simply notes that a well-installed system softens a fall in a predictable way across both surface types.
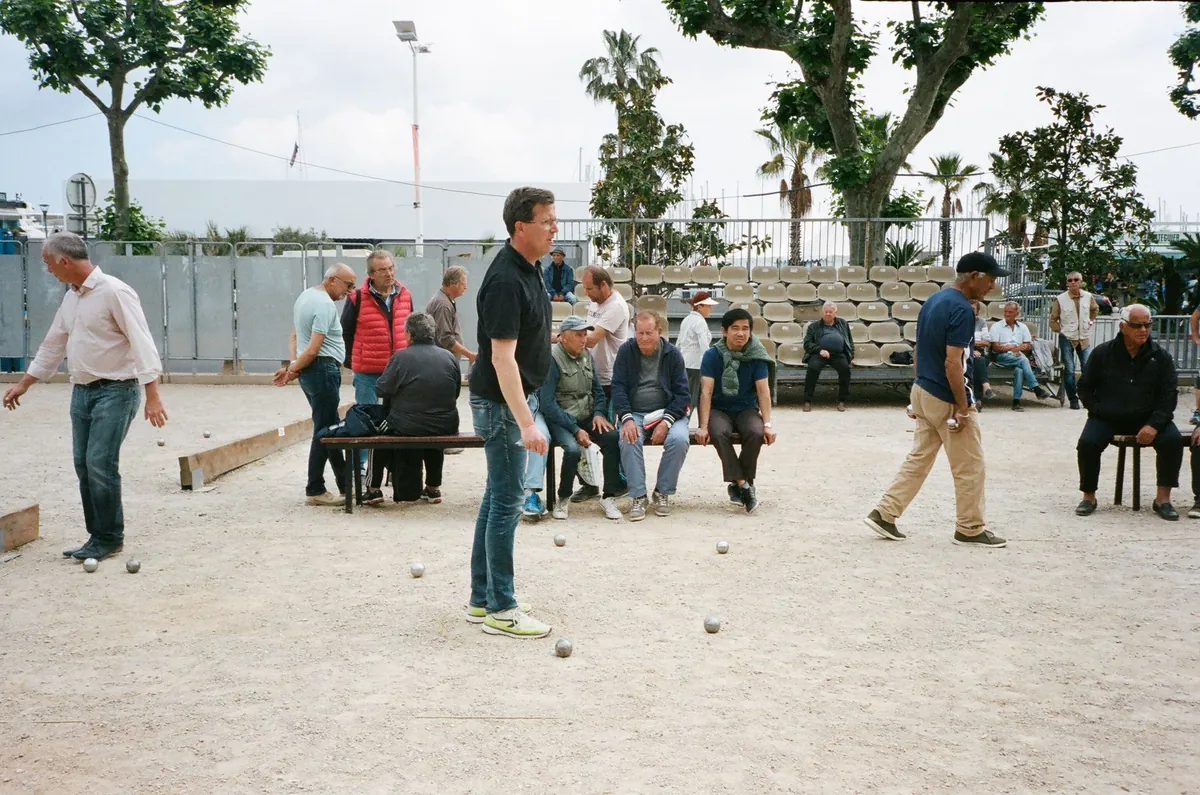
Where parents and staff really notice the surface difference is in hidden dips and ruts. Those form on natural grass over a school year. Synthetic surfaces keep their level across the same year.
On surface temperature, publicly cited research from Penn State and Brigham Young University points in the same direction. Synthetic surfaces run hotter than surrounding air in strong sun, and hotter than natural grass in the same spot. Schools that handle heat well move the busiest play into shaded sections, run a short watering pass before lunch break, and reserve midday for seated activities.
Parents usually accept this once they see the routine; what they resent is being told the surface never gets warm. Across many artificial turf installations in school playgrounds, the temperature routine is written into the staff handbook. That simple step turns a hidden risk into a managed activity.
For school buyers selecting a playground build, browse playground turf options and ask the supplier to walk through the planning steps, not just the spec card.
Mud, Allergens and Childcare Hygiene: Daily Cleaning Differences
Three daily concerns shape the comparison: mud tracks into the corridor, grass pollen reactions for sensitive children, and hygiene around diaper change and snack zones. None of these is dramatic on its own, and the school year is what makes them decisive.
Mud transfer is the comparison most parents understand at a glance. Natural grass sends soil through the gate, up the steps, and onto corridor floors every time it rains, which adds daily cleaning labour and slip risk in the wet hour. Synthetic surfaces keep the soil out of the equation because the surface is engineered not to lose material. What enters the building is rain water and small debris, both easy to mop.
Grass pollen is the comparison most relevant to allergy-aware families. Children and staff who react to grass pollen find relief on a synthetic surface. There is no pollen, no mowing dust, and no freshly cut grass smell in the air. Dust mites, ambient pollen from nearby trees, and food allergens still travel, so a synthetic surface is not a fully allergen-free zone, and the comparison only covers the grass component.
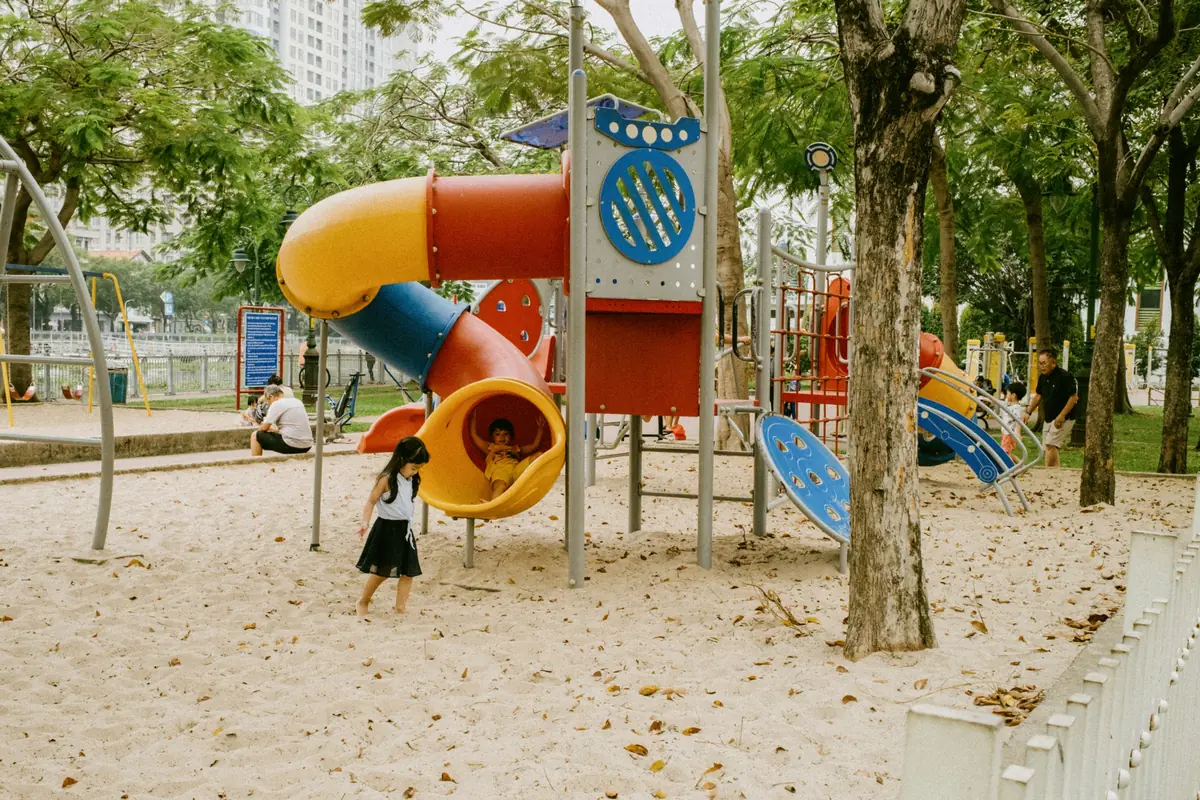
Diaper and snack hygiene is the comparison that decides nursery decisions more than any other. A synthetic outdoor surface has no loose soil to contaminate a diaper change, no grass blade to harbour food residue, and a flat profile that lets staff wipe spills fast.
The full cleaning routine for synthetic turf, from neutral cleaner to dilute disinfectants and water rinsing, lives in artificial grass cleaning guidance. Here it is enough to note that the routine is short, repeatable, and works whether the nursery runs twenty or eighty children. A natural grass surface cannot be wiped clean in the same way.
Routine Inspection and Maintenance Man-Hours: The Hidden Annual Cost
The most under-counted line in the comparison is the inspection and maintenance man-hour, because it does not appear on the day-one invoice. Natural grass demands weekly mowing, monthly fertilising, seasonal reseeding, irrigation checks, and edge trimming. Those tasks scale up with area and never scale down. Synthetic turf asks for a brush pass, debris removal, and a quarterly deeper clean, and those tasks stay roughly the same regardless of area size.
For a school with a modest outdoor area, public maintenance guidance points to roughly a ten-times difference in routine labour between natural and synthetic surfaces. A school that spends a full day each week on natural lawn care will typically spend a fraction of a day on synthetic upkeep. That gap flips the comparison in the school budget review, because labour is the largest variable line the head and the bursar control.

For a childcare centre the comparison shows up as frequency rather than total time. Synthetic surfaces ask for short, predictable cleaning rounds several times a day. Natural grass asks for water checks, mowed edge inspections, and weather-driven rescheduling. The synthetic version fits a nursery timetable; the natural version does not, and parent fee structures usually cannot absorb it.
Three other routine points sit in this comparison. Synthetic turf needs an annual check of seams, edge fixing, and infill levels, which a grounds team can run during a quieter week. Natural turf needs pesticide decisions, fertiliser timing, and water use compliance that sit with the estates manager year-round. Across many artificial turf installations in school districts, the annual check is the one predictable line that planners can book.
Rain, Winter and All-Year Availability
Availability is the comparison the timetable quietly makes for the school. A wet week closes a natural grass playground for days, and a winter freeze keeps it closed for longer. A well-installed synthetic surface with proper drainage reopens within a short window after rain and stays open through cold months, so PE lessons and lunch breaks stay on the calendar.
For schools in temperate climates, the practical comparison comes down to how many usable days each surface adds. Public playground guidance describes a sliding scale from short soil recovery on natural grass to quick drainage-return on synthetic. The wider the area and the heavier the use, the larger that gap becomes in real teaching time.
Childcare centres feel this comparison differently. A wet morning that closes a natural outdoor area forces children into a smaller indoor space, which raises supervision pressure and lowers the day’s activity budget. A synthetic surface that drains and dries fast keeps the outdoor plan on schedule. Across many artificial turf installations in early-years settings, the daily rhythm of outdoor time stays predictable through the wet season.
Set the Right Surface for Your Grounds
Spec cards cannot show how a surface behaves when 200 children use it after lunch. Sample a square metre on your site, run the cleaning routine on a corner, and write what you learn into the brief the head and parents can both read.
Budget Framing: Upfront vs Total Cost of Ownership
The budget comparison turns on one decision. Do you want a low upfront number with rising lifetime costs, or a higher upfront number with a flat lifetime line? Natural grass gives the first shape, synthetic gives the second, and the head and the bursar will recognise both from past projects.
For the installed side, factory-direct pricing for playground-grade synthetic turf lands in an indicative $7-60 per square metre range, with the spread driven by pile density, backing, and infill options. This is indicative only, and request an exact quote is the rule. That square-metre number is roll cost, not installed cost. The installed comparison for a school includes base preparation, drainage, edge fixing, shockpad in fall zones, and waste handling.
The lifetime comparison is where the choice usually lands. Lifetime lines the estates team tracks include water, irrigation repairs, mowing contracts, fertiliser rounds, reseeding after dry spells, and replacement after extreme wear. Across many artificial turf installations in school districts, those lifetime lines collapse to brushing, occasional infill top-up, and a deep clean every quarter or two. The lifetime gap is what closes the upfront gap over a typical school cycle.
For a fuller breakdown of how each line on the bill builds up, the cost-per-square-metre factors for commercial grass installations sit in a sister page. This comparison keeps the budget shape here.
Where Natural Grass Still Earns Its Place: Honest Boundaries
Synthetic does not win every comparison, and pretending otherwise loses trust with parents and boards. There are honest boundaries where natural grass still earns its place, and this comparison names them openly.
The first boundary is large area with light use. A sports field of several thousand square metres that runs a handful of matches a term, with a solid maintenance team behind it, takes very little from synthetic. Natural grass handles the volume cheaply, supports biodiversity, and brings open green space to the school estate. Replacing that field is more about pressure than logic.
The second boundary is biodiversity and outdoor learning. Natural grass supports insects, birds, and the soil web that builds teaching moments for biology and geography lessons. A school that runs an outdoor classroom and values that ecosystem gets real teaching value out of natural grass, even with the maintenance cost. Synthetic grass returns that value in usability, not biodiversity, and the comparison cannot pretend the trade-off away.
The third boundary is community appearance and tradition. Prospectus photos, summer fetes, sports days, and ceremonial use often look better on a real lawn. A school that values presentation and tradition, and has the grounds team to keep it up, will keep natural grass for the right reason. The goal is the right surface in the right place, not synthetic everywhere.
The fourth boundary is mixed surface and pilot projects. Many schools do best with a hybrid. Synthetic in the wear zones, under equipment, along fence lines, at the bottom of slides. Natural grass elsewhere. Honest comparisons lead to mixed layouts more often than to single-surface answers.
Talking With Parents and Boards: Saying ‘Synthetic’ Plainly
Parents and board members hear “synthetic grass” and quietly run through three concerns. They want to know how hot it gets, whether their child will get hurt, and whether the plastic is safe. The comparison answers all three if the conversation starts with what the school actually plans to do, not with what the surface is or is not. Schools that win parent trust say “plastic-based” or “synthetic” out loud and pair it with an action.
For heat, the parent-friendly line is short. The surface runs warmer than natural grass in strong sun, so the school waters it before lunch, moves active play to shade, and keeps midday for quieter activities. Parents accept this because the school is not pretending the problem does not exist.
For falls, the parent-friendly line is also short. Synthetic and natural both soften falls when installed correctly. The school uses a shockpad in the equipment zone, and the supplier can show independent playground safety guidance if a parent wants to read more. Bringing a reference rather than a slogan usually works better than any reassurance.
For chemical concerns, the parent-friendly line stays grounded. Synthetic turf contains no pesticides, and the routine uses neutral cleaning products. A diluted disinfectant appears only where the surface touches food or diaper areas. Schools that publish their cleaning product list on the parents page remove most suspicion. For an objective reference on the wider school-surface conversation, national federation guidance on school athletic surfaces is a useful anchor to point to.
The board-friendly version of the same conversation is structural. Show the inspection cost difference, the lifetime cost shape, the rain-day availability gain, and the maintenance workload difference. Boards understand predictable cost lines. Predictable lines move votes faster than any safety promise.
Making the Decision: A Short Framework for Estates Managers
A short framework closes this comparison and keeps it useful after reading. Gate one is use intensity: high-footfall wear zones go synthetic, open-field sports with light schedules stay natural, and mixed layouts sit between the two. Gate two is daily routine: sites that need a fast clean every day go synthetic, while sites with a strong grounds team and flexible timetable can stay natural. Gate three is communication: sites that welcome plain language go forward, while sites where parent concerns dominate do better with a hybrid that does not raise the same questions.
For the brief that goes to a supplier, five lines cover most of the comparison work. The first two lines name the area in square metres and the use intensity for each zone. The third line names the local climate and rainfall pattern, the parent communication line the school is willing to own, and the budget upper and lower limits plus base work. A brief that holds those five lines turns a vague request into a comparable quote. The supplier should also be told the timeframe the school expects for the artificial turf installation to pay back the higher upfront cost, and the maintenance needs across its life.
Order free samples before the full order. Lay a square metre on site, walk it in shoes and barefoot, brush it, hose it, and time how long it takes to dry. The notes from that test go straight into the brief, and they make the final decision easier to defend at the next parents’ evening and the next board meeting.
Frequently Asked Questions
Is artificial grass safer than natural grass for schools?
Both surfaces can be safe when properly installed. Synthetic adds surface consistency and drainage predictability. Specific fall height ratings and shockpad details sit in playground safety guidance, not here.
Does synthetic grass get too hot for children to play on?
Surface temperature rises above the air temperature in strong sun, which is openly discussed. Water before use, move active play to shade, and avoid long sessions at midday in summer.
How long does artificial grass last in a school playground?
Lifetime depends on use intensity, climate and maintenance. Schools planning long horizons should compare total cost over a fixed period and rely on samples for the day-one choice.
What does an artificial grass playground cost vs natural grass?
Natural grass costs less upfront and more over time. Synthetic costs more upfront and offers predictable lifetime lines. Compare installed cost over eight to ten years, not day-one numbers.
Do parents object to synthetic grass at schools?
Most parents ask about heat, falls and chemicals. Honest answers about what the school does on each point, paired with an objective reference like playground safety guidance, usually settles it.
 English
  Arabic
  French
  German
  Portuguese
  Russian
  Spanish